














Featured case study

A vintage brown and gray typewriterAI · LegalA Litify Expert That Cites Its SourcesRead the case study
Not sure where to start?Tell us what you’re trying to solve. We’ll point you to the right team.Talk to an expert

Featured case study

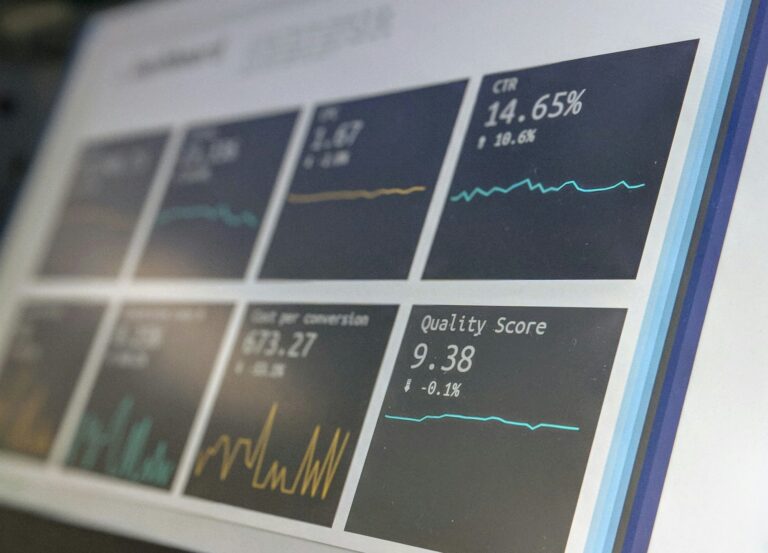
A screen showing charts and performance metricsData · HealthcareLive Risk KPIs, Embedded Where Clients Already WorkRead the case study
Not sure where to start?Tell us what you’re trying to solve. We’ll point you to the right team.Talk to an expert

Featured case study

A modern stone building with an evergreen tree out frontGovernment & Nonprofits · Web & DigitalA Member Website a Union Can Rely OnRead the case study
Not sure where to start?Tell us what you’re trying to solve. We’ll point you to the right team.Talk to an expert
Staff Augmentation

Experienced developers and admins who work inside your team, your tools, and your process.

Featured case study

A pink brain outline beside a maze shaped like the other half of a brainCustom Development · HealthcareAn Embedded Engineering Team, Six Years and CountingRead the case study
Not sure where to start?Tell us what you’re trying to solve. We’ll point you to the right team.Talk to an expert
AppExchange Products

Apps BRIO built for Litify and Salesforce, installed and supported by the team that made them.

Featured case study

A tall glass building facade with rows of windowsLegal · LitifyAutomated Client Communication Inside LitifyRead the case study
Not sure where to start?Tell us what you’re trying to solve. We’ll point you to the right team.Talk to an expert
Legal

Litify and legal technology from a team that includes former lawyers and paralegals.

How we help

Common challenges we solve

  • Case data scattered across legacy systems
  • Manual records requests, notes, and court emails
  • Reporting that leadership can trust
Healthcare

Secure platforms and analytics for care providers, benefits firms, and health advocates.

How we help

Common challenges we solve

  • Sensitive data that needs careful protection
  • Enrollment and review deadlines that never move
  • Clients asking for clear, current metrics
Finance & Insurance

Enrollment, claims, and internal tools built on data you can audit.

How we help

Common challenges we solve

  • Internal roadmaps bigger than the team
  • Claims and pricing work stuck in spreadsheets
  • Strict review and release standards
Construction & Utilities

Portals, field data, and reporting for contractors, utilities, and job-site services.

How we help

Common challenges we solve

  • Customers who want self-service requests and reports
  • Field data that is hard to act on
  • Operations running on aging systems
Government & Nonprofits

Mission-driven systems built to serve people well and protect sensitive information.

How we help

Common challenges we solve

  • Several systems for one organization
  • Sensitive records with need-to-know access
  • Small teams managing large websites
Media & Retail

Commerce and back-office systems for businesses with one-of-a-kind products.

How we help

Common challenges we solve

  • Inventory that must stay in sync online and in store
  • Catalogs and publishing done by hand
  • Stores that need steady updates
Technology & Startup

Scalable platforms and integrations for teams that move fast.

How we help

Common challenges we solve

  • Choosing a stack you will not outgrow
  • Shipping fast without piling up debt
  • Adding senior talent without long hiring cycles

Let’s build it

Building something new?Tell us where you’re headed. We’ll help you choose a platform you won’t outgrow.Start the conversation
All industries Browse case studies by industryNot listed? Our process works across sectors.
/
/
One Number Leadership Can Act On: Designing a Composite KPI

Insights

Open role

One Number Leadership Can Act On: Designing a Composite KPI

Dashboards with a dozen charts often leave leaders comparing numbers instead of making decisions. A well-designed composite KPI turns many measures into one clear signal, if you build it carefully.

Data · Healthcare · Tableau
Colorful building pieces assembled into a single mosaic

Most dashboards have a quiet problem: they show everything and decide nothing. A leader opens a report with twelve charts across twenty locations and has to do the hard work themselves, comparing trends, weighing measures against each other, and deciding what actually needs attention.

A composite KPI solves that by combining several measures into one score. Done well, it tells people where to look first. Done poorly, it hides problems behind a number nobody understands.

When a single score makes sense

A composite KPI works best when:

  • People need to compare many units, such as facilities, offices, teams, or portfolios, on the same terms.
  • Several measures together describe “good performance,” and no single one tells the whole story.
  • The audience needs to act quickly, not study every chart.

It’s the wrong tool when a single measure already answers the question, or when the audience needs to manage each measure separately.

How we designed one

For a healthcare risk management firm, BRIO designed custom KPIs, including a composite facility score, so the firm’s clients could evaluate performance across their care facilities with a single number. Clients see at a glance which locations need attention, then drill into the detail behind the score. Here’s what we learned along the way.

1. Start with the decision, not the data

Ask what the score should help someone decide. “Which facility needs a visit this month?” leads to a very different score than “Which facility is our best performer this year?”

2. Choose a small set of measures that matter

Pick the few measures that genuinely reflect performance, such as how quickly incidents are responded to and closed, and how promptly they’re reported. More inputs don’t make a better score. They make it harder to explain.

3. Put measures on the same scale

Different measures come in different units: hours, days, percentages, counts. Each needs to be converted to a common scale before it can be combined, and the direction has to be consistent so that “higher” always means “better.”

4. Weight on purpose, and write it down

Decide how much each measure counts, with the people who’ll use the score. Document the weights and the reasoning, so the score can be explained and revisited as priorities change.

5. Always let people see behind the number

A score should be the start of a conversation, not the end of one. Every composite KPI should link to the measures that make it up and to the records behind those measures. If people can’t see why a score moved, they won’t trust it.

6. Keep definitions consistent everywhere

The same score, calculated the same way, should appear in dashboards, alerts, and client-facing portals. Shared, documented definitions are what make a composite KPI trustworthy. That’s why we treat data culture as part of the work.

Common mistakes to avoid

  • Too many inputs. A score built from fifteen measures is impossible to explain.
  • Hidden weights. If nobody knows how the score is calculated, nobody will defend it.
  • No drill-down. A number without detail invites argument instead of action.
  • Set and forget. Review the score with its users regularly and adjust it as the business learns.

One good number can change how leaders spend their time. Want help designing KPIs your team will actually use? Learn more about our Tableau and data visualization work.

Frequently asked questions

What is a composite KPI?

A composite KPI combines several performance measures into a single score, making it easier to compare units such as facilities or teams and see where attention is needed.

How many measures should a composite KPI include?

Usually just a few. A small set of meaningful measures is easier to explain and trust than a score built from many inputs.

How do you keep a composite KPI trustworthy?

Document how it’s calculated and weighted, keep the definition consistent everywhere it appears, and let users drill into the measures and records behind the score.


At a glance

About this guide

Share this role

Industry & services

Topics

Data · Healthcare · Tableau

Share

Have a similar project?

Planning a project?

Tell us what you’re working on and we’ll share how we’d approach it.

Talk with a consultant about your goals, timeline, and data. We’ll help you map out next steps.

Interested in this role?

Apply below with your LinkedIn profile and resume.

Keep reading

Related work

A vintage brown and gray typewriter
AI · Legal · Litify

A Litify Expert That Cites Its Sources

Plenty of people talk about retrieval-augmented generation. BRIO built and runs it: a Litify knowledge expert that answers product questions only from

Read more →

A screen showing charts and performance metrics
Data · Healthcare · Salesforce · Tableau

Live Risk KPIs, Embedded Where Clients Already Work

A healthcare risk management firm wanted its clients to see incident trends without another login. BRIO designed custom risk KPIs and Tableau

Read more →

A white brain model with a cursor and the letters ai on a yellow grid
AI · Salesforce

Estimates You Can Trace Back to the Code

A ticket lifecycle where AI reads the client's actual repository before it writes a technical spec or an estimate, and refuses to

Read more →

Get started

Careers

Apply for this role

Let’s build your success story

Have a question about your project?

Tell us what you’re working on. We’ll follow up to set up a discovery call.

Share a few details, your LinkedIn profile, and your resume. Our team reviews every application and follows up.

What happens next

1

We review your note and follow up

2

A discovery call with a BRIO consultant

3

Clear recommendations and next steps

What happens next

1

We review your application

2

An intro call with our team

3

Interviews and next steps

We only use your information to respond to you.